提出问题:
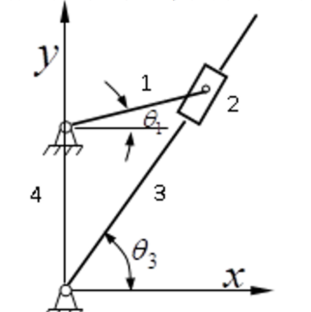
在如左图所示的摆杆中,已知:
$\iota_1$ = 0.6 m
$\iota_4$ = 1.2 m
$\omega_1$= 3 rad/s
假如原动杆以$\omega_1$的恒定角速度转动,尝试导出机构3的角位置 $\theta_3$、角速度 $\omega_3$、角加速度$\alpha_3$
建立模型
1、首先要将运动机构简化为数学模型,可以很轻易得出如右图所示模型;
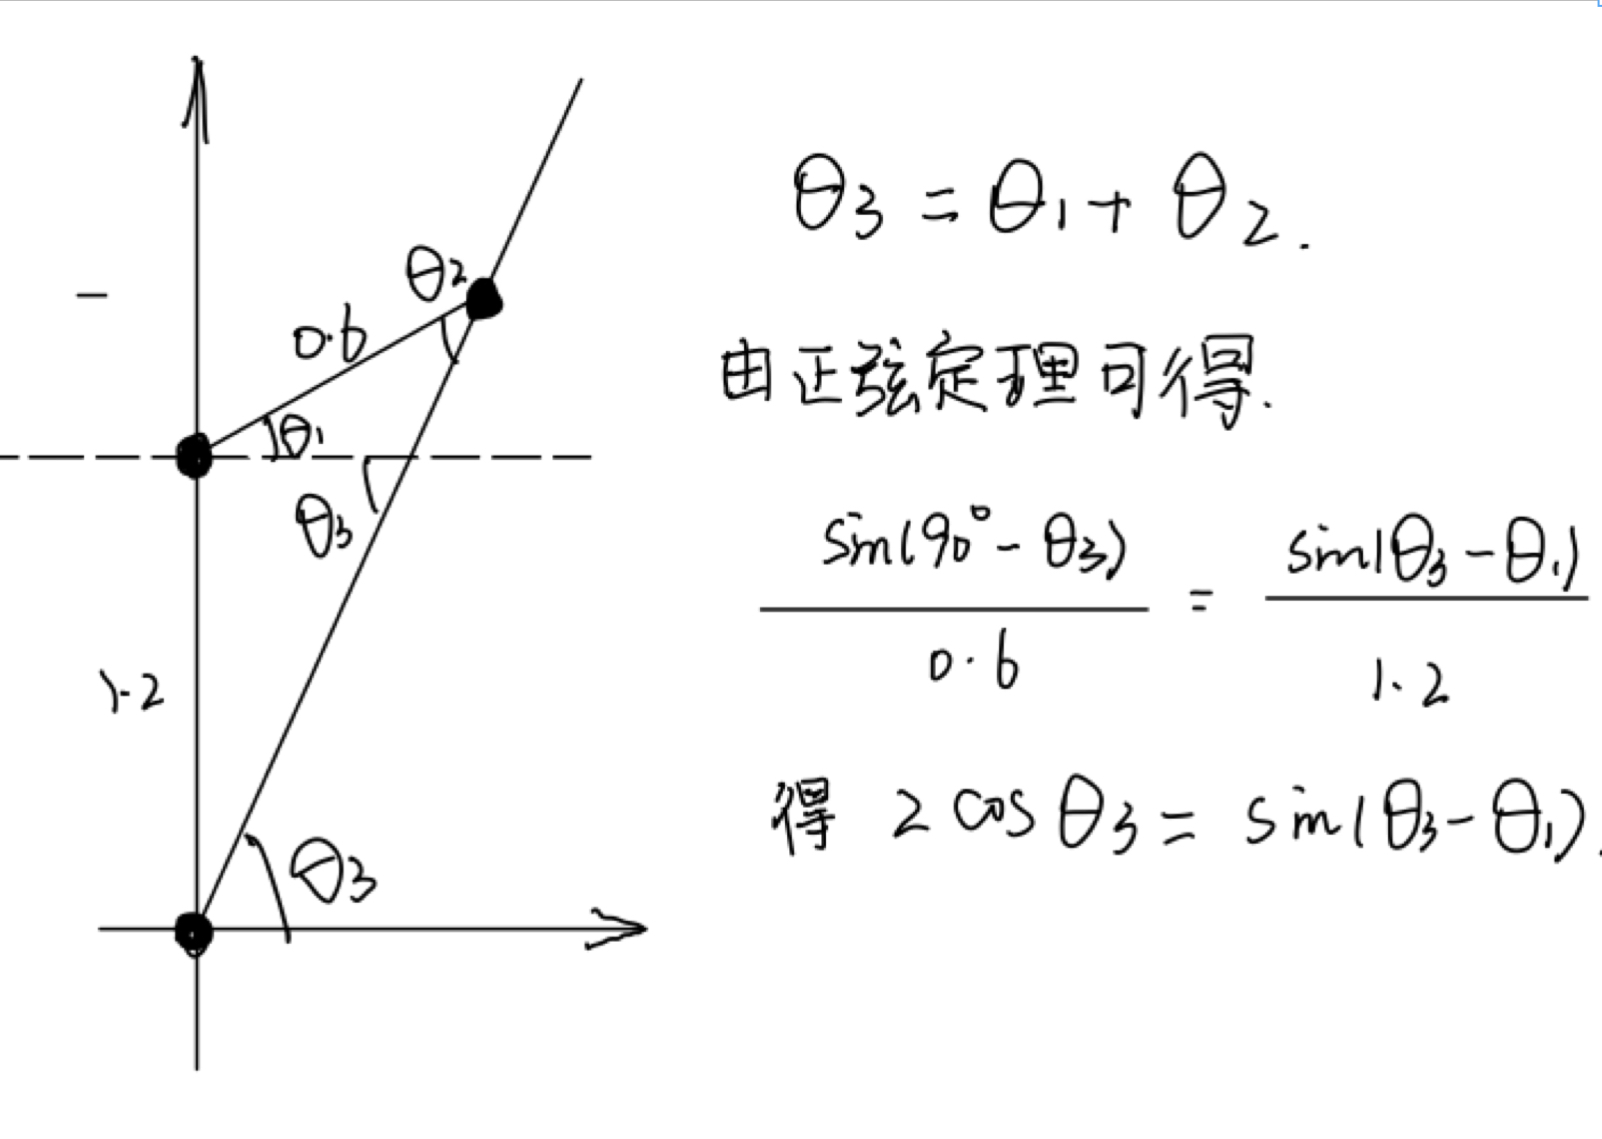
2、求出 $\theta_3$ :
3、因为$\theta_3$要满足如此条件 : ($\frac{\pi}{3} \leqslant \theta_3 \leqslant \frac{2\pi}{3}$)。且用反三角函数解出来的 $\theta_3$ 有一跃变的过程。 故,对 $\theta_3$ 对弧度值小于0的 $\theta_3$ 进行 $\theta_3$ = $\theta_3$ +$\pi$ 处理,可以得到正确的 $\theta_3$ 值。
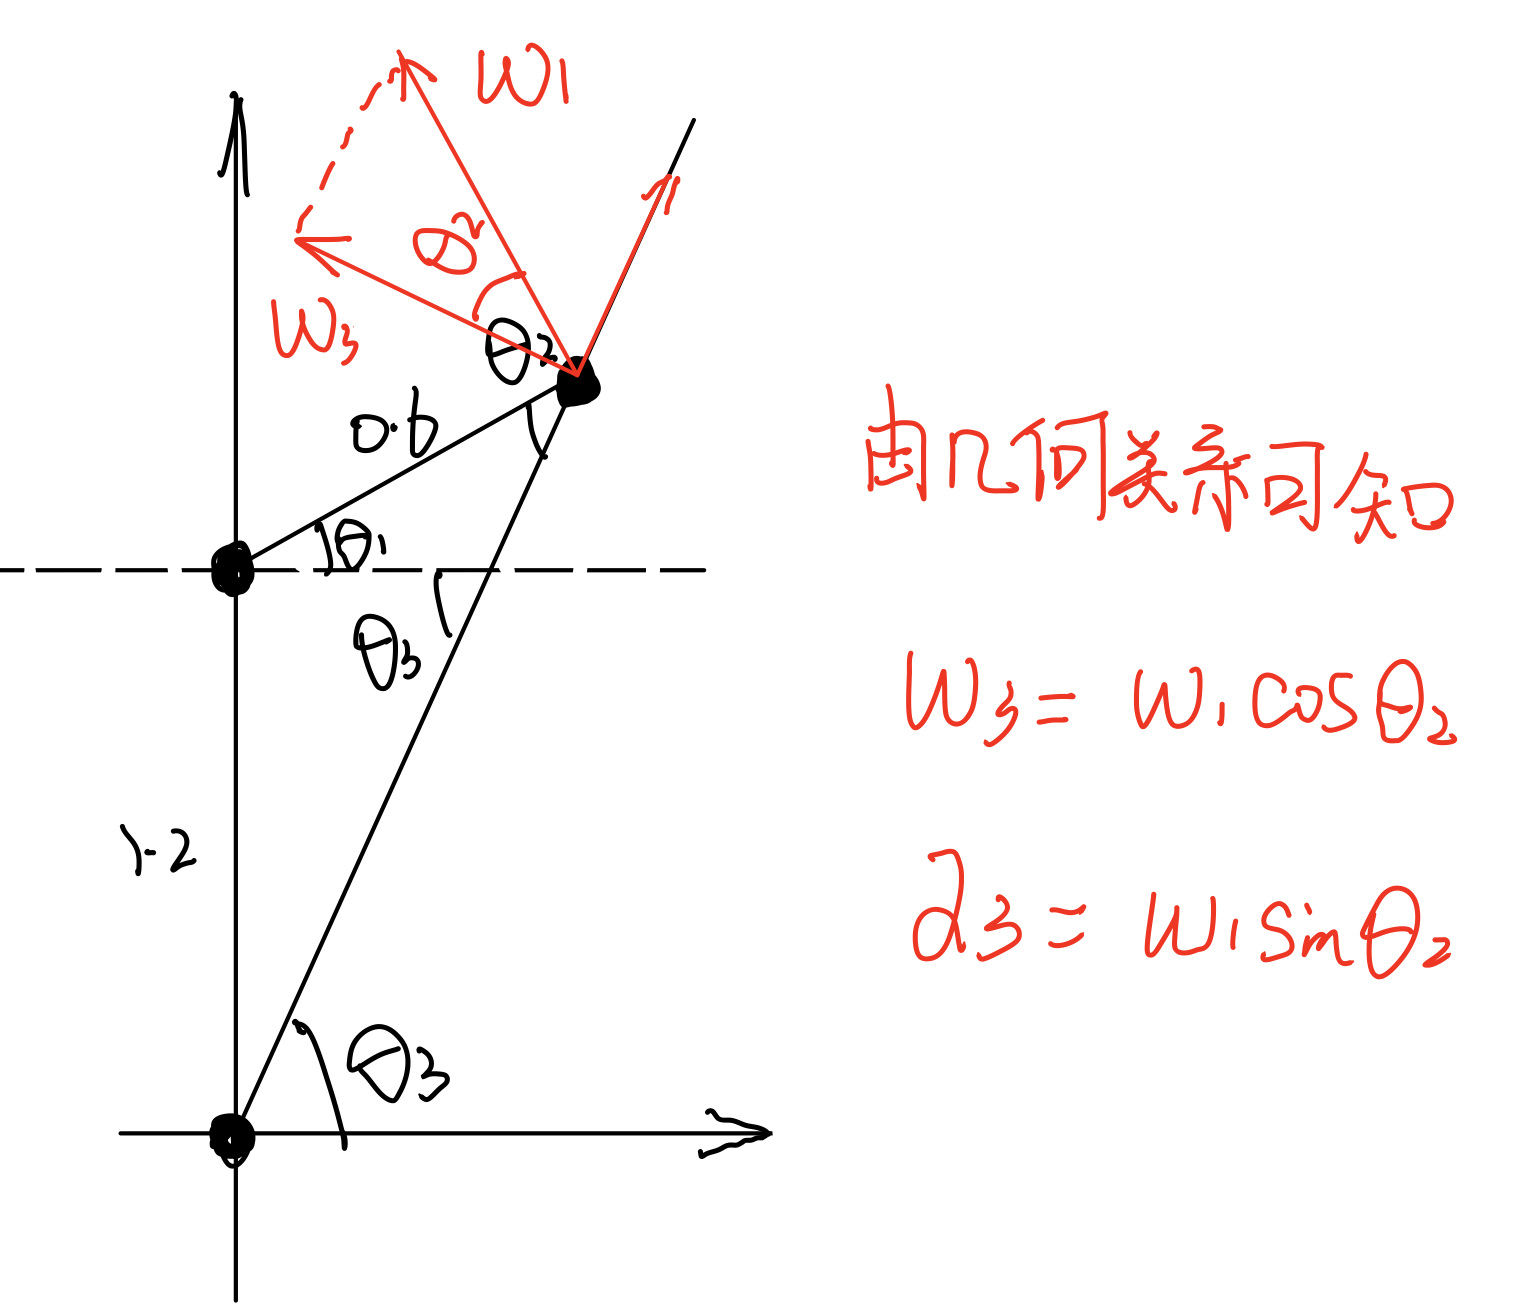
4、求出 $\theta_3$ 后,则 $\omega_3$ 、$\alpha_3$ 求法就简单:
5、对以上数学模型进行处理,分别带入到Excel、Matlab中,可以输出运行结果‘
Excel计算数据
| \theta_1 (\cric) | \theta_3 (rad) | \omega_3 (rad/s) | \alpha_3 (rad/s^-2) |
| 0 | 1.107148718 | 1.341640786 | 2.683281573 |
| 5 | 1.125474919 | 1.523293436 | 2.584487784 |
| 10 | 1.145395003 | 1.693764615 | 2.476118218 |
| 15 | 1.166705008 | 1.8532794 | 2.359100563 |
| 20 | 1.189228628 | 2.002024817 | 2.234255275 |
| 25 | 1.212812651 | 2.140153305 | 2.10231868 |
| 30 | 1.237323155 | 2.267786838 | 1.963961012 |
| 35 | 1.262642349 | 2.385021177 | 1.819800535 |
| 40 | 1.288665945 | 2.491929983 | 1.670414607 |
| 45 | 1.315300953 | 2.588568628 | 1.516348395 |
| 50 | 1.342463822 | 2.674977634 | 1.358121738 |
| 55 | 1.370078875 | 2.751185712 | 1.196234584 |
| 60 | 1.398076962 | 2.817212405 | 1.031171308 |
| 65 | 1.426394312 | 2.873070353 | 0.863404163 |
| 70 | 1.45497152 | 2.918767192 | 0.693396048 |
| 75 | 1.48375266 | 2.954307121 | 0.521602754 |
| 80 | 1.512684489 | 2.979692149 | 0.348474818 |
| 85 | 1.541715716 | 2.994923043 | 0.174459074 |
| 90 | 1.570796327 | 3 | 0 |
| 95 | 1.599876938 | 2.994923043 | -0.174459074 |
| 100 | 1.628908165 | 2.979692149 | -0.348474818 |
| 105 | 1.657839993 | 2.954307121 | -0.521602754 |
| 110 | 1.686621134 | 2.918767192 | -0.693396048 |
| 115 | 1.715198341 | 2.873070353 | -0.863404163 |
| 120 | 1.743515692 | 2.817212405 | -1.031171308 |
| 125 | 1.771513779 | 2.751185712 | -1.196234584 |
| 130 | 1.799128831 | 2.674977634 | -1.358121738 |
| 135 | 1.8262917 | 2.588568628 | -1.516348395 |
| 140 | 1.852926708 | 2.491929983 | -1.670414607 |
| 145 | 1.878950305 | 2.385021177 | -1.819800535 |
| 150 | 1.904269499 | 2.267786838 | -1.963961012 |
| 155 | 1.928780002 | 2.140153305 | -2.10231868 |
| 160 | 1.952364025 | 2.002024817 | -2.234255275 |
| 165 | 1.974887646 | 1.8532794 | -2.359100563 |
| 170 | 1.99619765 | 1.693764615 | -2.476118218 |
| 175 | 2.016117734 | 1.523293436 | -2.584487784 |
| 180 | 2.034443936 | 1.341640786 | -2.683281573 |
| 185 | 2.050939135 | 1.148541591 | -2.771435046 |
| 190 | 2.065326477 | 0.943691779 | -2.847708873 |
| 195 | 2.077281554 | 0.726754602 | -2.910640436 |
| 200 | 2.086423264 | 0.497376043 | -2.958482224 |
| 205 | 2.092303368 | 0.255215338 | -2.989124476 |
| 210 | 2.094395102 | -1.1485E-15 | -3 |
| 215 | 2.092081706 | -0.268380304 | -2.98797122 |
| 220 | 2.084646809 | -0.549719909 | -2.949204642 |
| 225 | 2.071270364 | -0.843253913 | -2.879048947 |
| 230 | 2.051036647 | -1.147288675 | -2.771953949 |
| 235 | 2.022965068 | -1.458669382 | -2.621504079 |
| 240 | 1.986079566 | -1.772071484 | -2.420694664 |
| 245 | 1.939536273 | -2.07917744 | -2.162642174 |
| 250 | 1.882826066 | -2.367960099 | -1.841945974 |
| 255 | 1.816048477 | -2.622540252 | -1.456805623 |
| 260 | 1.740206377 | -2.824297227 | -1.011605247 |
| 265 | 1.657404473 | -2.954765565 | -0.518999474 |
| 270 | 1.570796327 | -3 | -3.67545E-16 |
| 275 | 1.484188181 | -2.954765565 | 0.518999474 |
| 280 | 1.401386276 | -2.824297227 | 1.011605247 |
| 285 | 1.325544177 | -2.622540252 | 1.456805623 |
| 290 | 1.258766587 | -2.367960099 | 1.841945974 |
| 295 | 1.202056381 | -2.07917744 | 2.162642174 |
| 300 | 1.155513088 | -1.772071484 | 2.420694664 |
| 305 | 1.118627586 | -1.458669382 | 2.621504079 |
| 310 | 1.090556007 | -1.147288675 | 2.771953949 |
| 315 | 1.07032229 | -0.843253913 | 2.879048947 |
| 320 | 1.056945844 | -0.549719909 | 2.949204642 |
| 325 | 1.049510948 | -0.268380304 | 2.98797122 |
| 330 | 1.047197551 | -5.51317E-16 | 3 |
| 335 | 1.049289285 | 0.255215338 | 2.989124476 |
| 340 | 1.05516939 | 0.497376043 | 2.958482224 |
| 345 | 1.064311099 | 0.726754602 | 2.910640436 |
| 350 | 1.076266177 | 0.943691779 | 2.847708873 |
| 355 | 1.090653519 | 1.148541591 | 2.771435046 |
| 360 | 1.107148718 | 1.341640786 | 2.683281573 |
Matlab程序运算、作图
示例程序:
1
2
3
4
5
6
7
8
9
10
11
12
13
14
15
16
17
18
19
20
21
22
23
24
25
26
27
28
29
30
31
32
33
34
35
36
37
38
39
40
41
42
43
44
45
46
47
48
49
clear
clc
%已知:
l1=0.6;
l4=1.2;
w1=3;
th=[0:5:360]
th1=deg2rad(th)
th3=atan(((l4/l1)+sin(th1))./cos(th1));
th3(th3<0)=th3(th3<0)+pi;
om3=(w1.*cos(th3-th1));
al3=w1.*sin(th3-th1)
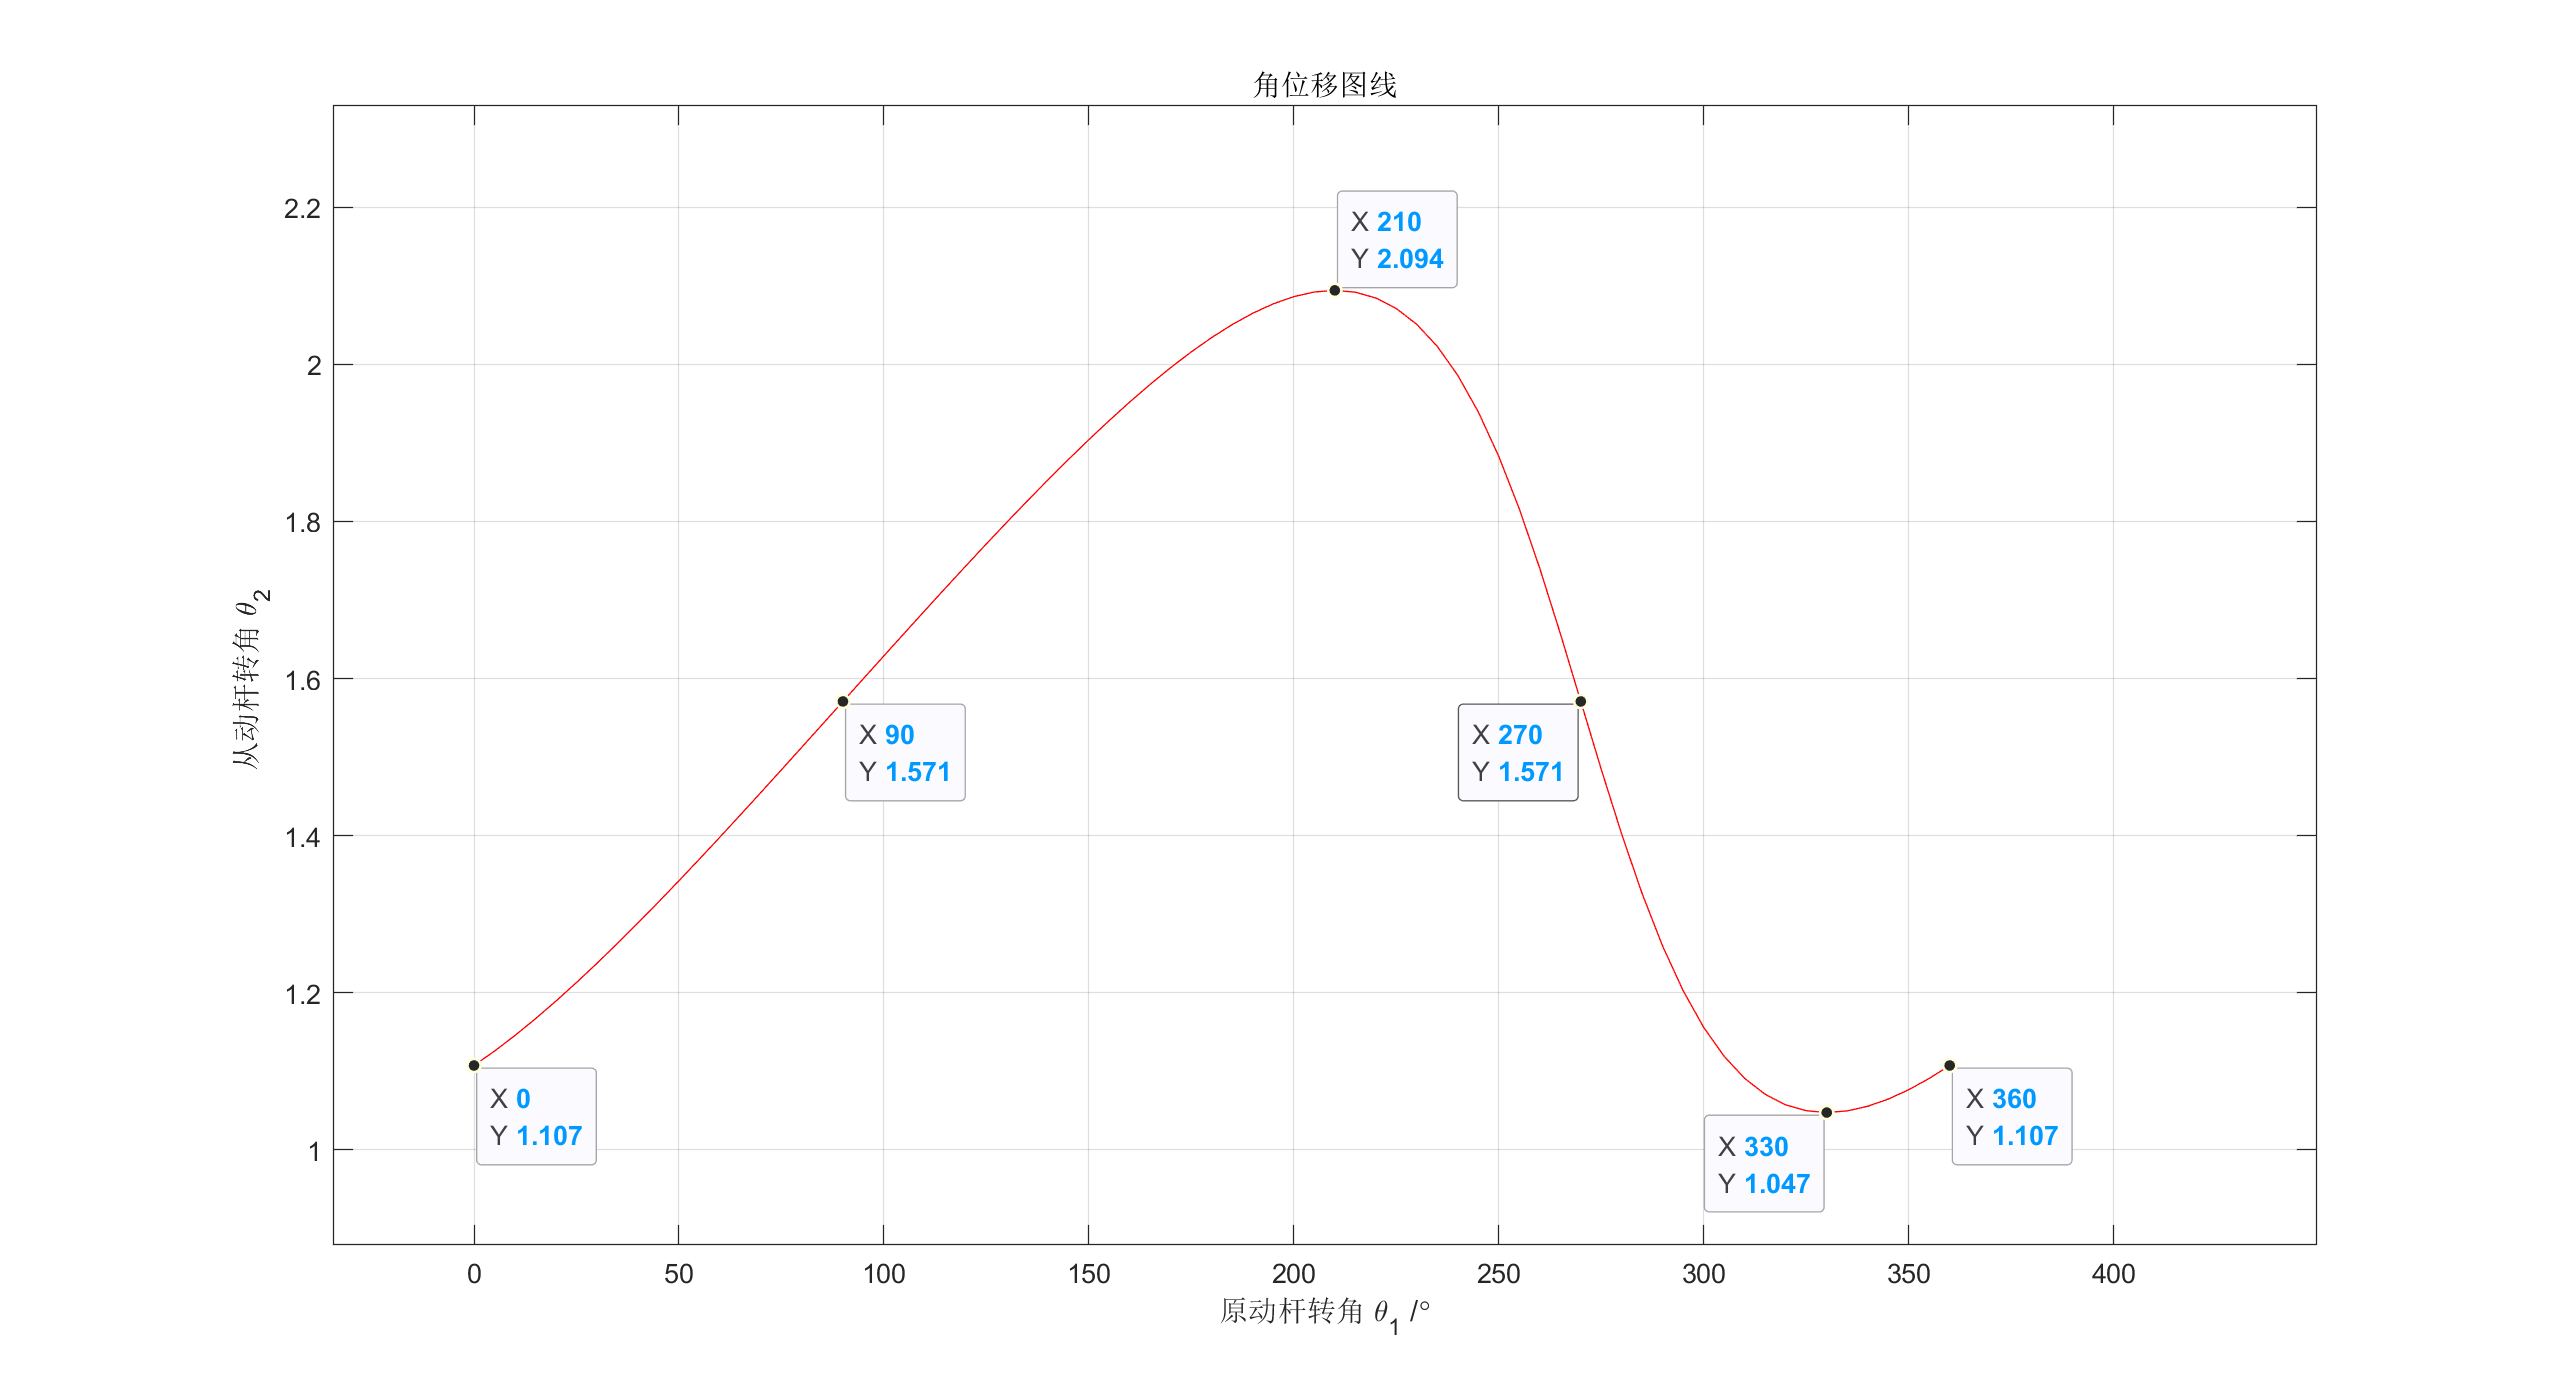
figure(1) %得到机构3的转动角度\theta_3的角度
plot(th,th3,'r')
title('角位移图线');
xlabel('原动杆转角 \theta_1 /\circ')
ylabel('从动杆转角 \theta_2 ')
grid on;
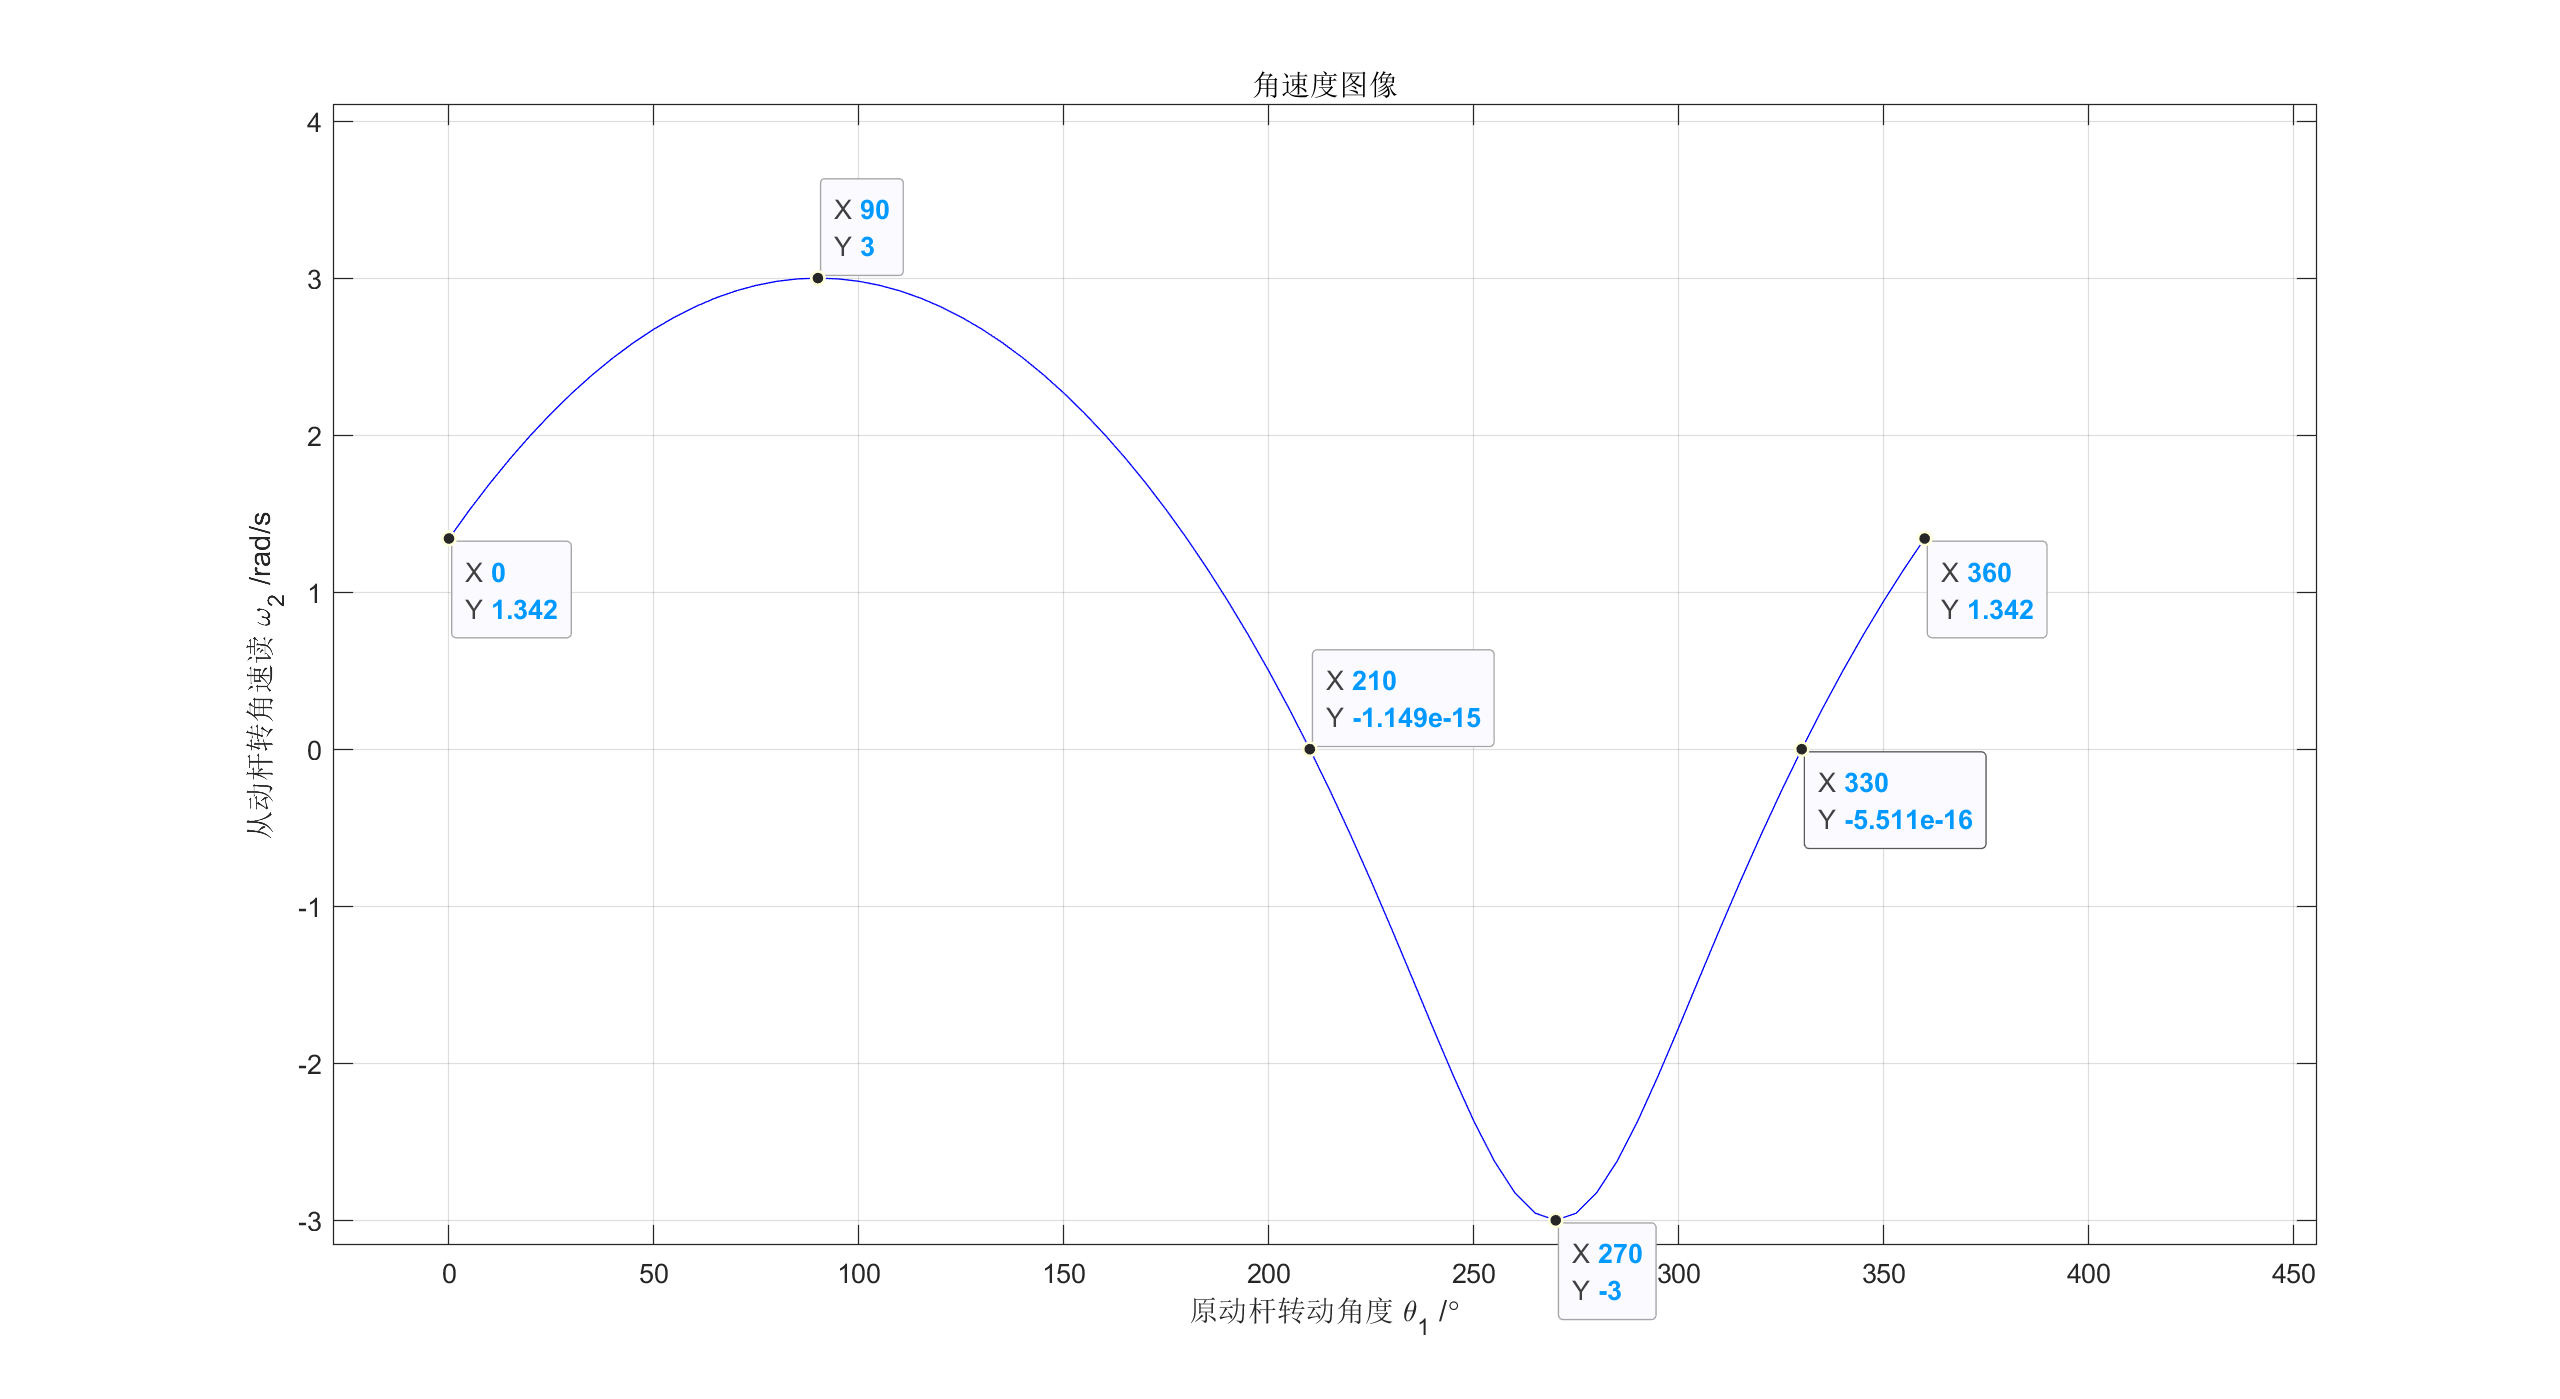
figure(2) %得到机构3的角速度\omega_3
plot(th,om3,'b')
title('角速度图像');
xlabel('原动杆转动角度 \theta_1 /\circ')
ylabel('从动杆转角速读 \omega_2 /rad/s')
grid on;
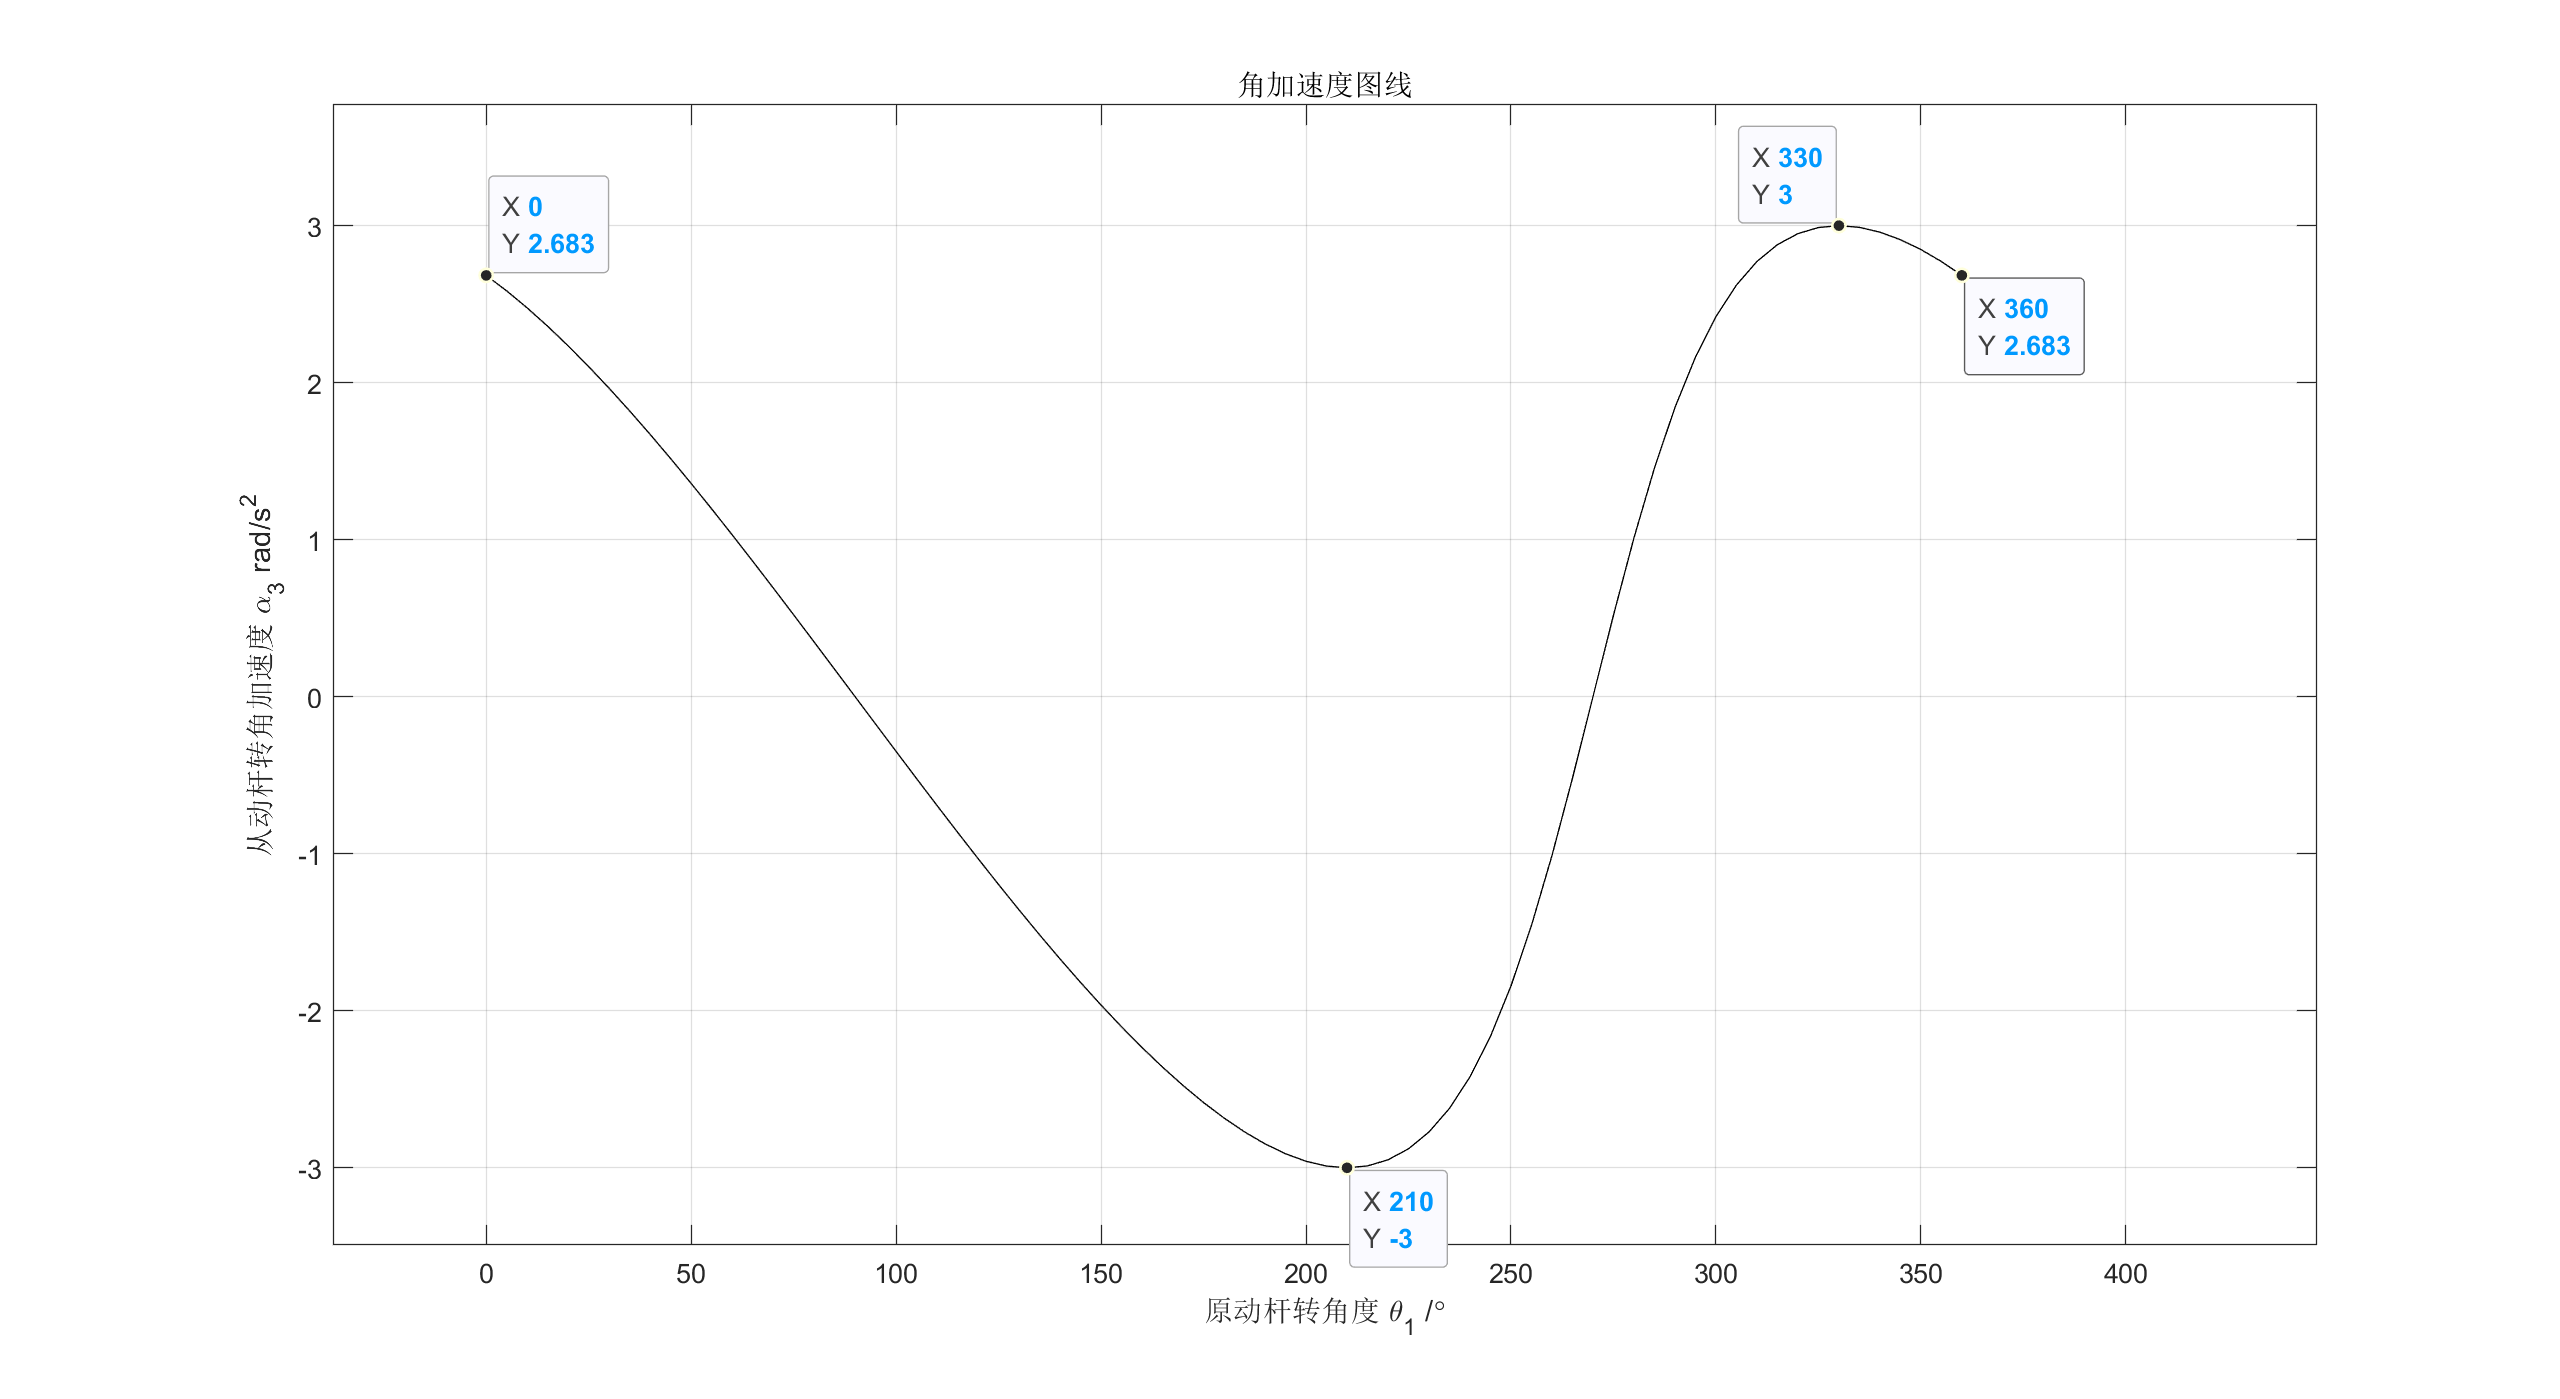
figure(3) %得到机构3的角加速度\alpha_3
plot(th,al3,'black')
title('角加速度图线');
xlabel('原动杆转角度 \theta_1 /\circ')
ylabel('从动杆转角加速度 \alpha_3 rad/s^2')
grid on;
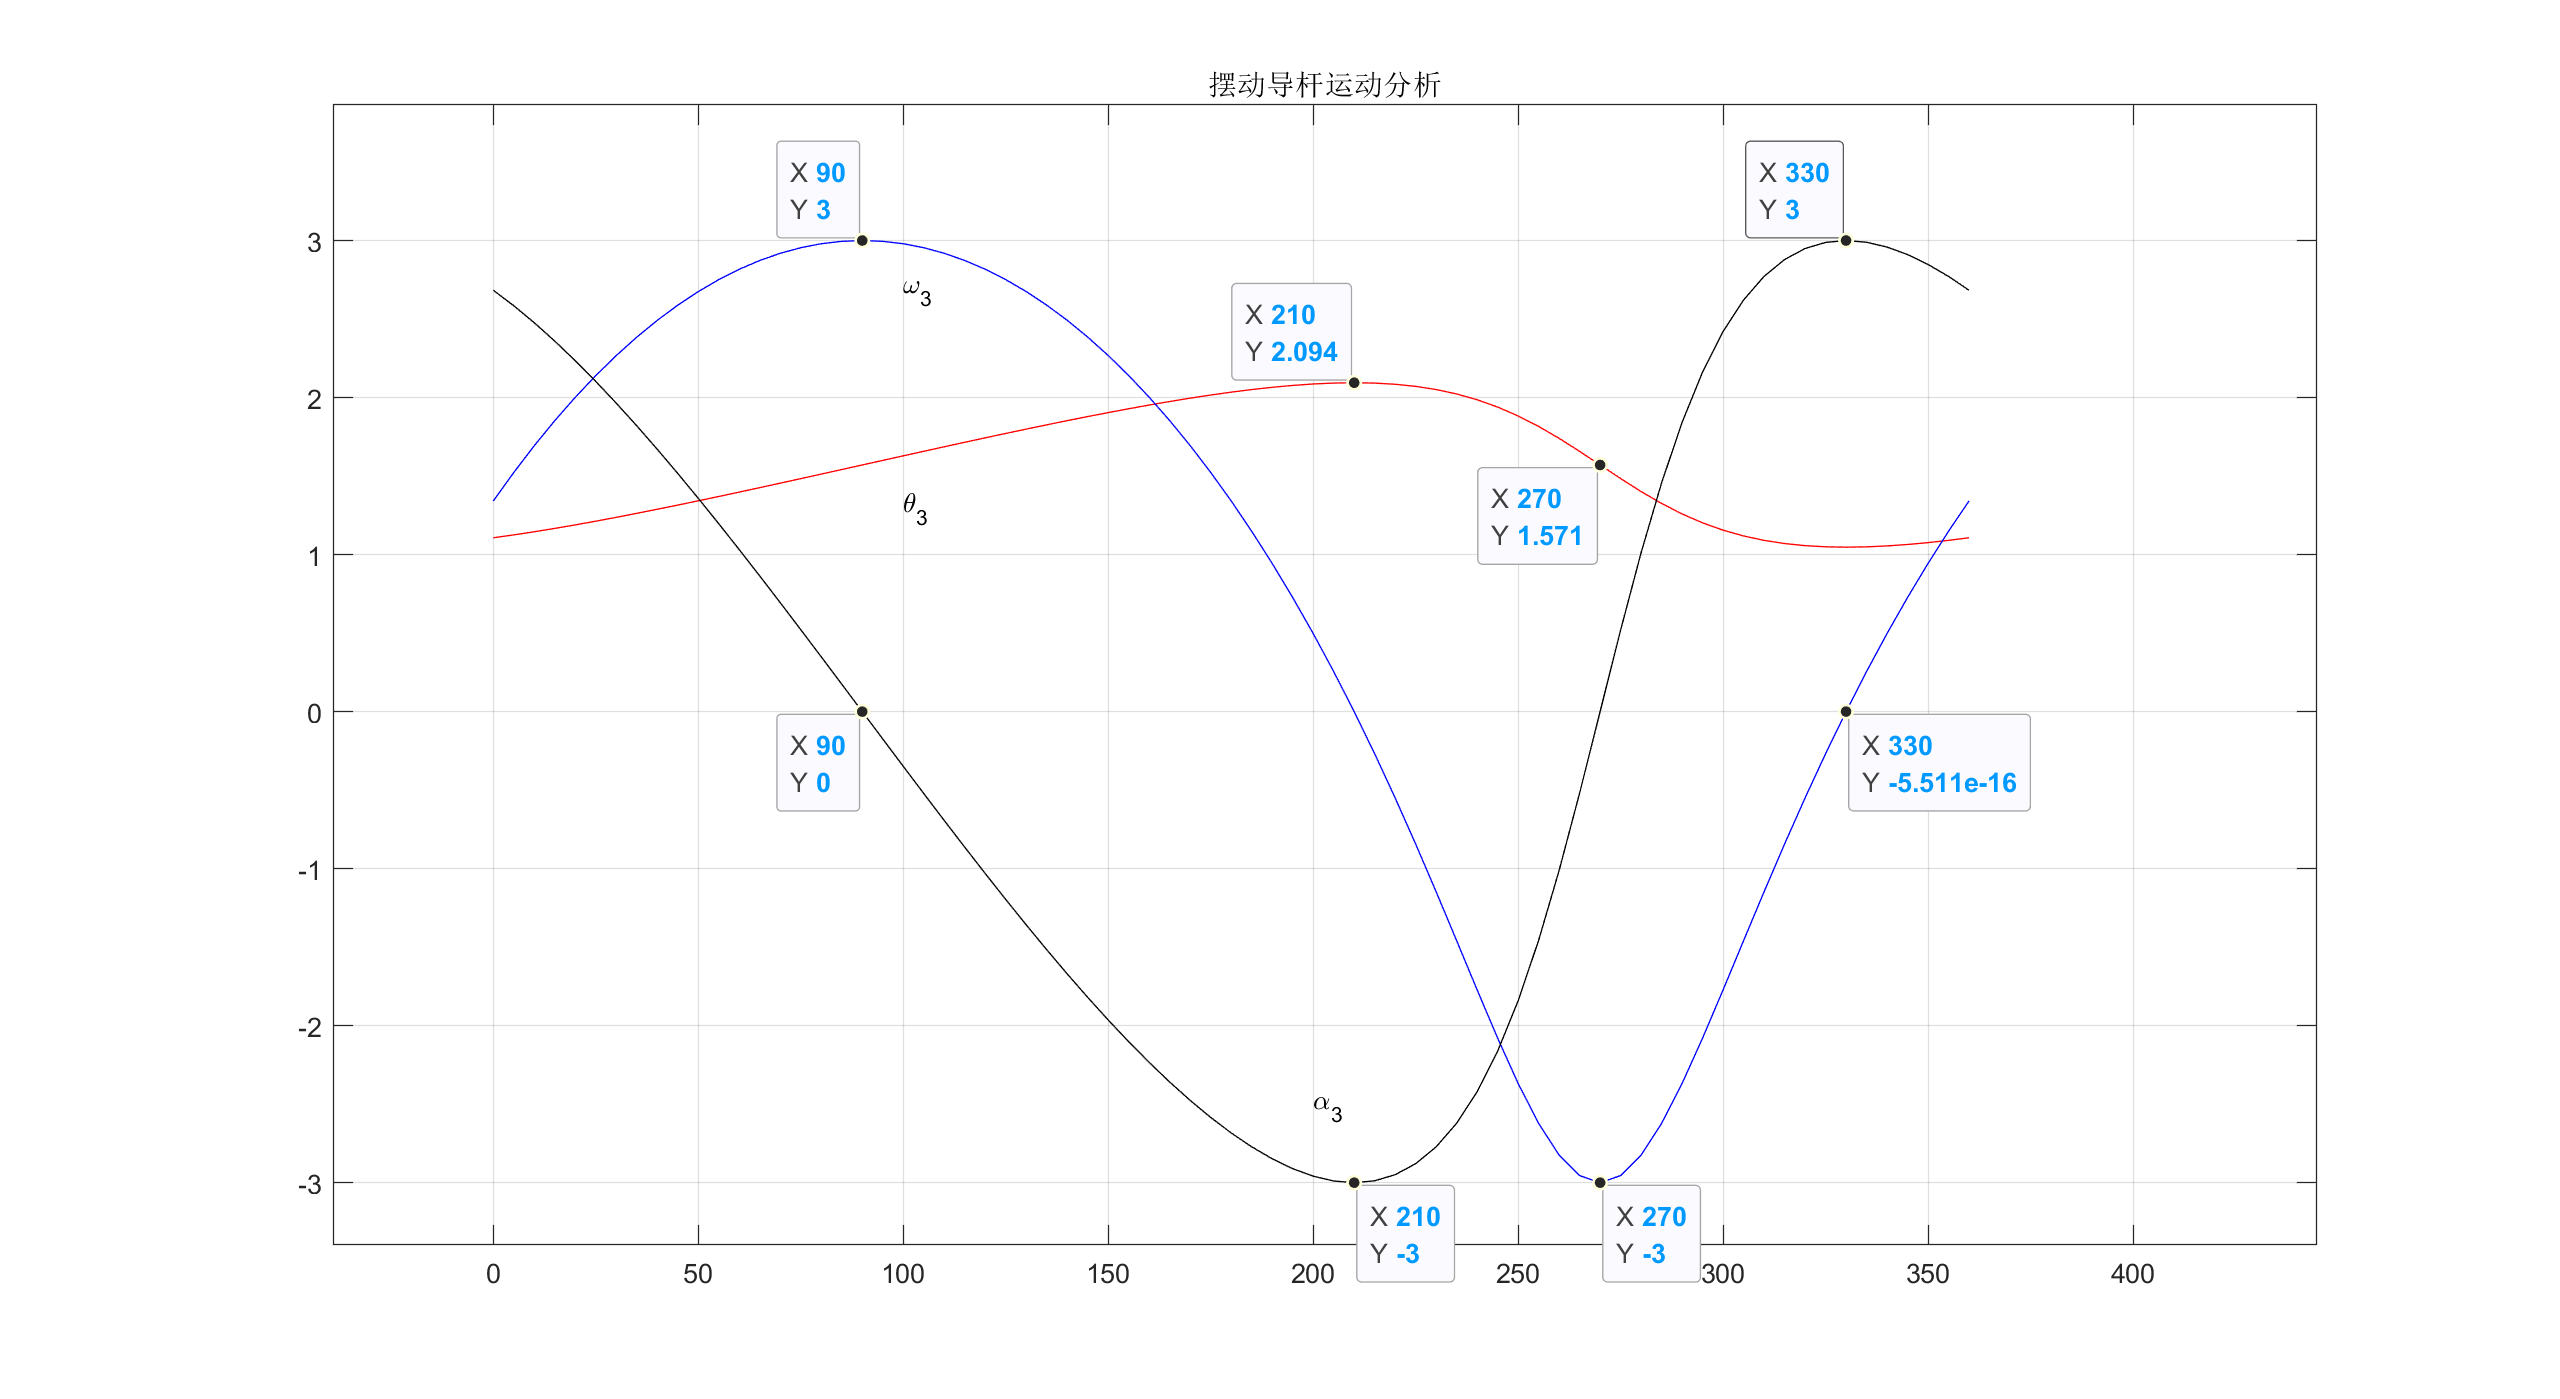
figure(4) %合并以上三个图像
plot(th,th3,'r',th,om3,'b',th,al3,'black')
title('摆动导杆运动分析');
text(100,1.3,'\theta_3')
text(100,2.7,'\omega_3')
text(200,-2.5,'\alpha_3')
grid on;
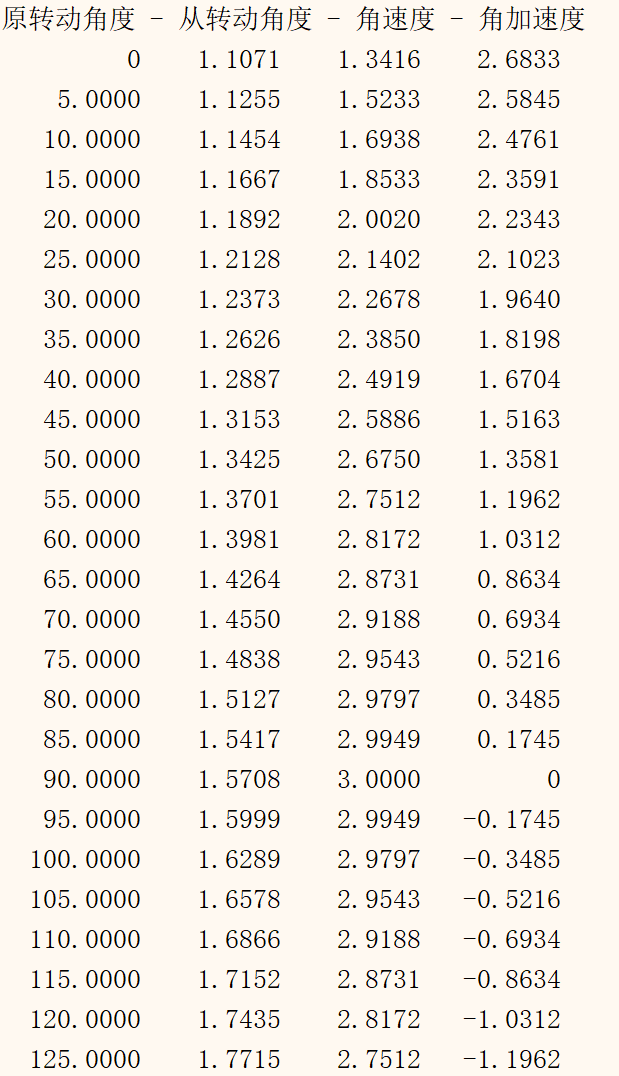
disp('原转动角度 - 从转动角度 - 角速度 - 角加速度')
y=[th',th3',om3',al3'];
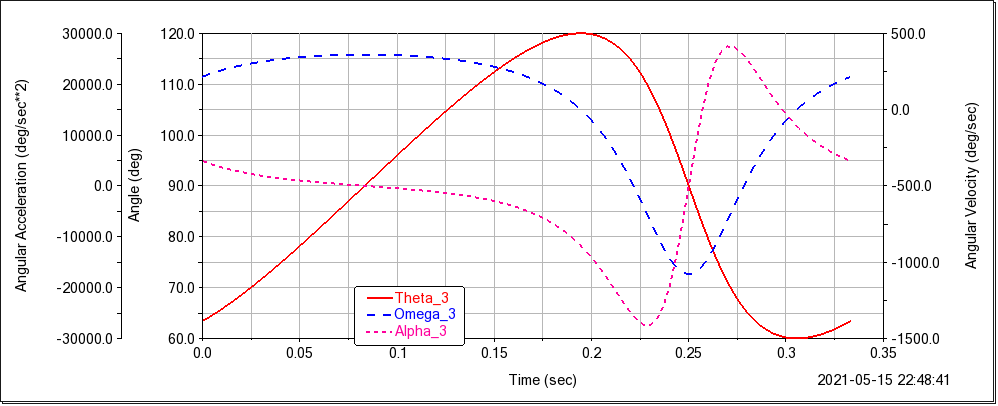
disp(y)得到以下图像:
得到同Excel数据:(节选)
Adams运动分析
模拟运动曲线